Showing posts with label opinion polls. Show all posts

18 July 2016

Referendum opinion polling after a tragic event

This post attempts to identify the impact of the tragic death of Jo Cox MP on opinion polling prior to the outcome of the 2016 UK EU referendum (“Brexit”). 
If any reader considers this to be distasteful, please accept my apologies and go no further. 

Jo Cox MP died on 16 June 2016 and her death was announced by West Yorkshire Police at 17:00 that day. Referendum campaigning was suspended and Parliament was recalled on 20 June. The campaigns resumed on 21 June. The polling took place on 23 June with the results as shown below:


Among those who voted (the turnout was 72%), Leave had a lead of 3.8%; among the total electorate this would be equivalent to a 2.7% lead.

On Monday 20 June in a Guardian interview Nicola Sturgeon, First Minister of Scotland, is quoted as saying (my emphasis on her first two, apparently contradictory, sentences):
I think it inevitably will [affect voting decisions]. It’s too early to say whether it will have a direct impact on the result. I think there was a bit of disgust setting in on Thursday morning about the Farage poster. I started to detect a sense of ‘if you’re voting leave, are you associating yourself with that?’. 
Obviously nobody knows whether the debate around the referendum had anything to do with what happened to Jo, but the sense that the debate had become a little bit poisonous and a little bit intolerant and focused on fear of foreigners as opposed to legitimate debate about immigration, I suspect what happened will have intensified those feelings.
The chart below shows the data from opinion polls conducted in June 2016 in terms of the lead for Leave. Polls which did not report “Don’t know/Won’t vote” numbers are excluded. The horizontal lines through the data points indicated the duration of the polling in each case. A typical polling error of ±2.5% is indicated as well. The extent to which polls adjust for voting intention is not always clear so both the leads identified above are shown.


Looking across the month, the polling prior to 17 June can be regarded as being spread around the actual outcome as would be consistent with their inherent margin of error. Polls after this date tend to indicate more support for Remain as the preferred outcome.

One explanation for this might be that, while Cox’s death had little effect on most voters’ real intentions, there was a tendency for them to conceal their intention to support Leave in responses to opinion polling between her death and the vote. So perhaps there was not such a contradiction, after all, in canny Sturgeon’s two sentences.


UPDATE 22 JULY 2016

YouGov's Anthony Wells has now posted on UK Polling Report an interesting review of what lessons can be drawn from opinion polling for the UK EU referendum.  The possible impact of the tragic death of Jo Cox is not discussed.


30 June 2016

Not so Superforecasting

Last November I posted here about Superforecasting and the Good Judgement Project (GJP), run by Professor Philip Tetlock at the University of Pennsylvania. Tetlock’s book, Superforecasting: The Art and Science of Prediction, had just been published. For more details about Superforecasting and my reservations about the technique, please read the post. One of Tetlock’s conclusions was that the top 2% of forecasters merit designation as “Superforecasters” and that their prognostications should be taken seriously.

During the UK “Brexit” referendum campaign up to Thursday 23 June, the Superforecasters’ estimated likelihood of the Leave campaign being successful was made available regularly on Twitter. Never expected to be more than about 40%, their final estimate, provided on polling day, was 24%, as can be seen below:


The result was a Leave win (with 52% of the vote). A couple of experts had anticipated the outcome, for example Nigel Smith on the Reaction website. Ironically, the campaign director for Vote Leave was Dominic Cummings, an enthusiast for Superforecasting (see my November post). Tetlock tweeted after the result was known:


and Cummings (@odysseanproject) was supportive :


(SW1 is the postal district which includes Westminster and Whitehall, ie the seat of government). 

Personally, I think Cummings is letting Superforecasting off lightly – they were way off on a topic which  is almost certainly of long-term significance regionally and beyond and has had more global attention than anything in the UK since the death of Princess Diana.

I suspect that most of the Superforecasters are US-based and were relying too much on the “received wisdom” generated by the London media.  These well-paid members of the intelligentsia have little understanding of attitudes outside the capital and its associated areas of prosperity eg Oxford, Bristol and so on. The Superforecasters probably also over-discounted the opinion polling in the light of the latter’s dismal performance before the UK general election in 2015. This time the polls didn’t do so badly and were indicating for most of June that the result would be very close, ie within their inherent margin of error of a few percent at best.

UPDATE 11 JULY

In the Financial Times FT Weekend 9/10 July there was an article by Robert Armstrong in their long-running Lunch with the FT series. The paper’s guest was Philip Tetlock and most of the reporting was a largely uncritical description of Superforecasting’s powers and of some good food. The lunch date had been before the Brexit vote,so Armstrong made a follow-up phone call:
I called Tetlock after the referendum result. As a fan of his work I was quite disappointed to hear that the “supers” got Brexit wrong too. Doesn’t this stumble on such a huge issue put his aspirations at risk? The supers did nail the Scotland referendum two years ago, confidently predicting that Scots would vote to stay in the Union when the opinion polls were very close, but the stumble on Brexit makes that look more like luck. 
“If they were only making predictions on those two topics, that would be a plausible hypothesis,” Tetlock replied. But the superforecaster teams have a much longer record, in which they do measurably better than luck or individual specialists. 
That Tetlock is totally unfazed by the Brexit miss is, in a sense, the whole point. He wants to replace the model of the all-knowing policy guru with something co-operative, empiricist; something fallible, but open to systematic incremental improvement. It is a vision of knowledge as a process of slowly but meaningfully upping the chance of being right — while acknowledging that it all remains a gamble.
Again I think Superforecasting is being allowed to get away with a failure on Brexit that should be unacceptable given the claims made. Here’s another forecast tweeted today:


Having to make an adjustment from 50% to 1% in a month rather undermines the notion of “supers” having a deeper and earlier understanding of what the future holds than anyone else! (I discussed discounting of late forecasts in the earlier post). I wonder whether this forecast is going to move much more before the 27th?


12 May 2015

UK General Election 2015

Back in March I was foolish enough to post about forecasting the outcome of the UK election on 7 May:
My hunch is that the LibDems will do better in their established areas than the national polling would suggest, and also that Labour will do better in Scotland than some of the forecasts are indicating.
Oh dear, my hunch was way wrong – so were other people’s forecasts, all based on opinion polling which turned out in retrospect, almost without exception (Survation and internal Labour party polling, both revealed after the event), to have been near useless until the exit poll. This chart updates one in the earlier post to show the final forecasts and the actual outcome:


That post had another chart, also updated below, which showed the relationship between the votes cast for Conservatives and Labour and the seats the parties obtained, both expressed as percentages. The first-past-the-post voting system tends to reward parties in that as they get more votes, they get even more seats (otherwise the dotted grey line would apply). However Labour does better than the Conservatives (the thin red line through their recent election results as opposed to the thin blue one). The dotted lines seem as good a guide as most of the more sophisticated forecasting models – assuming the forecast percentages of votes are correct.

Finally, will it be 1992 all over again in terms of the number of MPs? In the UK as a whole and looking at the two main parties, far worse for Labour alone, but in terms of Conservatives vs a Labour/Lib Dem/SNP bloc, remarkably similar. In England and Wales terms, Northern Ireland and Scotland both now being insignificant for the three main parties, Labour are slightly better placed than in 1992, but again in terms of Conservatives vs a Labour/Lib Dem bloc very similar:


7 October 2014

Modelling Neverendum

You might wonder why a blog apparently linked to the part of England which is furthest from Scotland takes any interest in the independence referendum held there on 18 September. Firstly, and obviously, all the regions of England would have been affected had the Yes vote won. Secondly, a particular regional interest was the subject of a post here in 2012, Would Scotland’s Loss be the South West’s Gain. This looked at the possible relocation after Scottish independence of the Royal Navy’s nuclear submarines to SW England, a subject which will be revisited in a future post. In the days after the referendum, two views seemed to emerge. One, delivered outside 10 Downing Street on the morning after by David Cameron, was that
… now the debate has been settled for a generation or as Alex Salmond has said, perhaps for a lifetime. So there can be no disputes, no re-runs – we have heard the settled will of the Scottish people.
But the outgoing SNP leader stated:
… the majority of Scots up to the age of 55 voted for independence, and a majority of Scots over 55 voted against independence … When you have a situation where the majority of a country up to the age of 55 is already voting for independence then I think the writing is on the wall for Westminster.
And his likely successor, currently his deputy, Nicola Sturgeon, was quoted by BBC News as saying when launching her bid to replace him:
… the country could only become independent if the electorate backed the move in a referendum. But she did not rule out the possibility of the SNP including a commitment to hold a second referendum in a future election manifesto.
The leader of the Scottish Conservatives, Ruth Davidson, subsequently warned that:
The SNP lost. Scotland demonstrated her sovereign will. And yet, people at the top want to run this race again as soon as possible. They want Scotland locked in a cycle of neverendum.
So it’s worth looking again at the actual result on 18 September:

Fig 1: Referendum results
The turnout, as has been widely pointed out, was remarkably high and unlikely to have been improved upon. So, for Yes to have succeeded, about 192,000 No votes would have had to come across. The main sources of insight as to how this could come about in another referendum at some point in the future are provided by opinion polling.

The polls were not startlingly accurate in their predictions in the run-up to the 2014 vote. In March this year a post here looked at one particular Ipsos-MORI opinion poll in detail. It had shown that at that time those certain to vote were divided 32% Yes, 57% No and 11% undecided. As the September vote approached, opinion polls started to indicate that the Yes/No balance had shifted to be much closer – closer in the polls it turned out, than in the actual result. Afterwards Professor John Cutis in his What Scotland Thinks blog concluded that there had been a systematic problem of underestimating the No vote beforehand. However, two essentially retrospective polls were carried out on referendum day by YouGov and Lord Ashcroft Polls and these had overall results close to the outcome and also provided a breakdown of voting behaviour:

Fig 2: Opinion polls post-voting
The two polls’ age data is easier to compare graphically, and tends to bear out Salmond’s view of older voters:

Fig 3: No voters by age from polls
The Ashcroft poll also asked:
Q.8 If it turns out that a majority has voted NO in the referendum, for how long do you think the question of whether Scotland should be independent or remain in the UK will remain settled?
Fig 4: answers to Q.8 by age
From this it is clear that nearly half of those who voted think the issue will not remain settled for more than 10 years, though, as in the 2014 referendum, enthusiasm for changing the status quo is less apparent among the older age groups. So what might happen in another referendum in five or ten years’ time? An impossible question to answer but it is possible to make an assessment, albeit crude, as to how demographics might have an effect. After all, the 16 year olds of 2019 are today’s 11 year olds and the 16 year olds of 2024 are today’s 6 year olds, today’s 11 year olds being 21 by then. A key source is Mid-2013 Population Estimates Scotland produced by National Records of Scotland in June 2014. First of all, their Infographic 1:
Fig 5: From Mid-2013 Population Estimates Scotland
This explains why the population of Scotland increased by 14,100 between mid-2012 and mid-2013. Using the data from YouGov quoted in Fig 2 above on voting preferences by place of birth (blue data below) it is possible to make a crude assessment of the voting impact of migration:

Fig 6: Possible effect of movements to and from Scotland in Fig 5
There are some obvious flaws. Firstly ‘People’ include children under 16 and secondly immigrant and emigrant preferences may be different from those by place of birth: Scottish No voters may be more outward-looking and therefore be more likely to be found in those leaving for the rest of the UK (RUK) and elsewhere than among their stay-at-home compatriots. There are other uncertainties: how many of those emigrating were originally from outside Scotland, went there and then didn’t like it? However, it isn’t easy to see how the net flow of inward immigrants combined with the pattern of the YouGov data could support hopes of a net increase in the Yes vote over the years ahead.

The ‘natural increase’ of 909 conceals much larger underlying population flows. Figure 5 from the Mid-2013 Population Estimates Scotland shows the facts of life and death:

Fig 7: From Mid-2013 Population Estimates Scotland 
(Anyone puzzled by the Male and Female notches at 65/66 should read this post!) Most of the nearly 56,000 deaths each year will be among the older members of the population, who, for this purpose, will be assumed to be over 65. The earlier comparison of No voters by age in the two polls (Figs 2 and 3) suggests that about 65% of the 65+’s are No voters. Table 1 of Mid-2013 Population Estimates Scotland contains details of Scotland’s age breakdown from which the numbers of new voters in 2019 and 2024 can be predicted (ignoring early deaths and migration). If the voting preferences of the new voters continues to be about 50% No, as the polling seems to suggest, there could be a shift to Yes of about 85,000 after 10 years due to ‘natural change’:

Fig 8: How 'natural change' might affect No vote
To describe this sort of modelling as simplistic is to be kind. Some of the underlying assumptions have already been made apparent, and there are others such as a lower turnout in future referenda differentiated by preference – fewer Nos, say. Also, the errors in the polls for subgroups are considerable – look at the two polls’ different estimates for Male and Female preferences (Fig 2 above) – and this can only get worse the smaller the subgroup, eg 16-18 year olds. As a sensitivity test (in italics in Fig 8) the assumptions made above can be altered in favour of Yes. If the No support among the group of emerging voters were to fall to 30% (unlikely), and the deaths were assumed to be among the oldest voters, and they had a No preference of, say, 75% (again unlikely, given female relative longevity and No preference), the shift to Yes would increase to about 190,000 – the number that Yes needed in 2014. This assumes, of course, that the majority of those who voted in 2014, who will still be alive in 2024, keep voting the same way and that the immigration/emigration effect in the meantime is nil.

So even if the emerging voters were Yes enthusiasts, it seems likely that a substantial number of those who voted No in 2014 would have to change their minds for Yes to get a majority in 2024. What might lead them to do so? This really is peering into the Scottish mists, but an unsatisfactory 'Devo max' (further devolution to Scotland as promised post-referendum), a successful Eurozone, a sovereign area solution for the Clyde naval base (keeping jobs and not antagonising NATO) all might help, as might Catalan independence.

On the other hand, the concentrated location of the Yes vote in 2014 is now well understood and the Yes vote might fall in those parts of Scotland not green in this map:

- not everyone in Scotland may warm to the prospect of being governed from the Republic of Glasgow.


19 May 2014

El Niño and Ed Miliband

The invaluable Ballots and Bullets Polling Observatory at the University of Nottingham’s School of Politics and International Relations recently produced their 36th summary of opinion polling of voting elections since the last election:


When I posted about their 28th summary last September, I suggested that there were two axes of symmetry. One showed Labour’s poll rise reflecting the Lib Dem’s decline, the other axis the same relationship between UKIP’s rise and the Tories’ decline. This idea now seems to have broken down. The Lib Dems still seem to be stuck on a plateau below 10%. The Tories seem to have done slightly better in the last six months – if that’s because some UKIP supporters have returned home, then UKIP has nonetheless kept its numbers up, perhaps at Labour’s expense.

Once the European Parliament elections are out of the way, UKIP may enter a long decline until 2015. If it does, it will be interesting to see if that benefits the Tories, or Labour or both. And some Lib Dems may return to the fold, mostly at Labour’s expense probably. John McTernan is a centre-left commentator whose opinions are, in my view, always worth considering. (For example, see his piece for the Guardian, John Smith would have led us to a decent world, on the 20th anniversary of the Labour leader’s untimely death). In the Scotsman on 8 May, McTernan concluded that the 2015 election will be hard to call:
The Tories will prosecute an apparently simple argument: the economy is working, don’t let Labour wreck it. … For Labour, the nightmare is economic growth quickening, incomes rising swiftly.
But
The fear of the government will be that events beyond their control will overwhelm them. One of the biggest is an interest rate rise. Former chancellors Norman Lamont and Alistair Darling are both warning that there is the danger of a housing boom. Voices off are one thing, but what if the Bank of England decides to act? So many families are stretched financially that the smallest increase in mortgages could be enough to tip them over the edge. The other is an NHS winter crisis. This is what did for the Tories under Thatcher and Major – patients on trolleys in corridors would be disastrous for Cameron, as they would be the emblem of public service cuts.
And of course, these possibilities are not mutually exclusive. But, as far as the NHS is concerned, the 2014/15 winter seems a long way off on a balmy day in May. This is particularly so when the last winter was so mild. To quote the UK Met Office:
Mean temperatures over the UK were well above the long-term average for all three months {December, January and February] with a mean winter temperature of 5.2 oC which is 1.5 oC above the average and the fifth highest in the series. There was a notable absence of frosts, and the lowest UK temperature of the winter, -7.7 oC at Altnaharra, Sutherland on 17th February was the highest such winter value for at least 50 years.
whereas the year before:
The mean temperature over the UK for winter was 3.3 °C which is 0.4 °C below the long term average. December was equal to the long term average for the month, January was 0.3 °C below, February was 0.9 °C below and at 2.8 °C was the coldest month of the season. Spells of notably mild weather occurred in late December and early January, and notably cold weather in early December, mid to late January, and the latter part of February.
The difference between the two winters comes out in the charts below (blue indicating below and red above average temperatures).

2013/14 (left) 2012/13 (right) Mean Dec Jan Feb temperature anomalies
Health planners are, of course, well aware of the effect of winter conditions on the demand for health services. For example, Public Health England have a Cold Weather Plan for England 2013, Making the case: why long-term strategic planning for cold weather is essential to health and wellbeing. This points out that:
Evidence shows that there is an increase in hospital admissions from cold-related illnesses, as the temperature falls … Admissions for chronic obstructive pulmonary disease increase as temperatures fall, particularly in those most socio-economically deprived. Hospitals and social care commonly face winter pressures. These often result from a high demand for beds and difficulties in discharging patients. This may be compounded by staff shortages due to illness. Cardiovascular, respiratory and infectious diseases with a seasonal increase, as well as weather-related accidents – contribute to raising the number of admissions. Prolonged in-patient episodes can result, either due to medical complications or a delay in discharging patients because of lack of suitable accommodation.
Also
Increased levels of illness due to cold weather can put a strain on local NHS services such as general practices and hospitals. There is evidence that cold weather may prevent people from accessing these services.
It would obviously be helpful for planners to know what the weather will be like next winter. The Met Office (in Exeter, Devon, SW England) has a team of researchers engaged on monthly to decadal prediction with one specialising in the El Niño Southern Oscillation, known as the ENSO. Just how the warming of waters in the tropical Pacific ocean affects weather in the northern hemisphere is complex with other factors to be taken into account, and is certainly a subject for experts. But in 2008 the Met Office did state that:
"We have shown evidence of an active stratospheric role in the transition to cold conditions in northern Europe and mild conditions in southern Europe in late winter during El Niño years".
So it was interesting to see a fairly high probability US consensus forecast for an El Niño event this year:

Not that it means any distinct probability of El N coming to the rescue of Ed M. Better to leave that kind of forecasting to John McTernan who, despite the uncertain start to his article, ended on a more confident note:
But while the big parties fight for tactical advantage, the result of the election will probably be determined by the two minor parties – the Liberal Democrats and Ukip. The Lib Dems’ fate is easily described. In 2010 Clegg sold sincerity to the public. He broke his word on tuition fees and broke his party. They have lost votes irreversibly to Labour and will lose seats to them and the Tories. Ukip is the wild card. It takes votes from the Tories – which is bad enough – but they are also dragging Cameron from the centre ground, which is worse for him. Elections in Britain are always won from the centre, but Nigel Farage has derailed the Tories. 
So, the centre-left is united behind Labour and the centre-right are split between three parties – the Tories, Ukip and the Liberal Democrats. This is a massive advantage for Miliband. Labour is currently on 35-38 per cent in the polls, a historically low level but in 2005 Tony Blair got a 65-seat majority with a similar figure. The reason? Ukip took 2,000 votes from the Tories in every seat. It was enough. No-one doubts Farage will raise that level next year. It’s advantage Miliband.


16 March 2014

Scottish Independence: from polling to voting

John McTernan writing in The Scotsman on 7 March gave his article, What next for Scots after No vote?, over to an examination of the politics of Scotland after September’s independence referendum. He made the assumption that the No vote will prevail. Nothing in the opinion polls suggests he could be wrong, but I thought it might be enlightening to look at a recent opinion survey in some detail to see what might underlie the way it was reported in the media. For example, on 4 March the Daily Telegraph, under a headline, Independence support drops after George Osborne's Scottish pound warning, compared the latest Ipsos MORI poll with an earlier one and concluded:
Overall, support for leaving the UK was down two points at 32 per cent compared to an identical survey conducted in December, while opposition to independence remained unchanged at 57 per cent.
Ipsos MORI have made the details of their survey available to anyone who wants to look at their Tables of data which are broken down as usual under various headings, eg age, gender, social class and so on. (Pollsters tweak their sample (weighting) to match what they think is the profile of the actual electorate – such adjustments are small and their effect won’t be discussed here). The interesting thing about a referendum is that on the day the votes can only be YES or NO, the only other options being to spoil your vote or not go to the polling station at all. But drawing conclusions from the responses to a survey like this one of 1001 people seven months beforehand is more complicated and I’ve attempted to indicate why in the diagram below:


At the top are the responses of the 1001 and, at this stage in the referendum campaign, as well as Yes and No, people quite reasonably can be Undecided. Also, some of the Yes’s and No’s have not made up their minds definitely (percentage figures from Table 3) and similarly some of those who feel Undecided may, nonetheless, have an inclination towards Yes or No (Table 22). The arrows indicate the changes in opinion that these uncertainties could lead to.

The survey asked the 1001 people how certain they were to vote on a scale from 1 (absolutely certain not to) to 10 (absolutely certain to) – 12 didn’t know (Table 24)! There were 779 who were 10s and in the middle layer of the diagram these are again broken down into Yes, No and Undecided. Again, some of these people, albeit definite voters, may yet change their minds (Table 8). It is the nominally Yes and No percentages here of 32% and 57% which the Daily Telegraph quoted. Again there are some arrows to indicate how these opinions might change as well.

779 in 1001 voters definitely voting would be a turnout of 78% of the survey. The table below shows the actual turnout by Scottish voters in elections and referenda since 1979*:


So 78% looks a bit optimistic judging by the last 15 years of turnouts. However, as the diagram indicates, it currently appears that for YES to secure more than 50% of the votes in September, one or more unlikely events would have to occur, for example a substantial failure to turnout by those currently intending to vote NO, or all the currently Undecideds turning out and voting YES, or substantial changes of mind by those who currently consider themselves committed to NO.

At which point, back to McTernan’s article.


*Data up to 1997 from Wikipedia, subsequently from Scottish Parliament.


11 February 2014

Ukippered

Last month Tim Whitemore headed a post on his Daily Telegraph blog How many Ukippers will be dead when the referendum happens? Sorry, but it matters.
He asked the question because of … a new YouGov poll [which] shows, while the old loathe the EU the young still think that we're better off remaining in it. While those over 60 would vote two-to-one to leave the EU if there was a referendum tomorrow, those under 25 would vote two-to-one to stay in, as this [chart] shows:

Something similar is true of immigration: those with degrees think it has been economically beneficial by a margin of almost three-to-one, and younger people are much more inclined to support taking refugees from Syria.
He went on to point out that:
While the population is ageing, the number of people who have been to university, lived abroad and weren't born until after Britain joined the EU is increasing – and these people, even as they get older, are more inclined to stick with Britain's membership.
and concluded:
The good news for Ukip, and Eurosceptics more generally, is that the ageing voters more inclined to support them are much more likely to vote. But ultimately both have the same problem: how can they address their lack of appeal with the young? If they do not find some compelling answers, changing demographics could destroy their ambitions at the ballot box.
I covered similar ground in a post here in 2011 which looked at the effect of age on views about Europe, international aid and the death penalty. I wondered:
Whether older people’s attitudes reflect biologically-driven changes in psychological outlook due to ageing, or past levels of formal education [is] something that will become clearer over the next few decades. Perhaps by the time people reach 60 it is the experience gained in the ‘University of Life’ which counts.
Whitemore didn’t actually answer the question he posed, perhaps out of deference to the elderly demographics of the Telegraph’s readership (the paper if not the website, though the majority of those who provide comments on the latter “below the line” seem to be either senile or deranged). However, Peter Kellner has gone a long way towards answering it on the Guardian Comment Network in an interesting analysis of how voters seem to have switched between parties since 2010. He made “a rough estimate of the number of supporters of each party who are likely to have died since the last election” as can be seen in the table below:


Kellner’s estimate is for the period between May 2010 and January 2014, 44 months, which is also the duration from now to September 2017, as good a guess as any for the date of the referendum. So, if there are currently 3.3 million Ukippers and the same proportion of them expire as Kellner estimated in the contingent who voted UKIP in 2010 (0.1 million in 0.9 million ie 11%), we could expect about 370, 000 of them to have popped their clogs by then. Assuming that most of the 2.4 million who have rallied to UKIP since 2010 have the same age profile as Ukippers in 2010, this answers the question as posed, but does not address the more interesting one as to how many people will be both alive and still supporting UKIP by then.

There is a problem with Whitemore’s chart in that there are not equal numbers in each of the age groups. If the areas are adjusted to correspond to the sizes of the four groups it looks like this:


and the preponderance of the older groups is brought out. However, a recent YouGov poll shows a smaller level of support for leaving, overall -3% as opposed to -10% here. In this recent poll the 40-59 age group seems markedly less opposed to the EU (-2% as opposed to -16% here).


6 February 2014

Lib Dem prospects in the South West

Next week London’s LBC radio will be going national on DAB, something that will almost certainly raise the profile of its weekday evening presenter, Iain Dale. Anyone who hasn’t heard of him should read his Wikipedia profile. I used to like going to his Politico's Bookstore and Coffee House until it closed and I have a few books from Biteback Publishing. A former Tory candidate, he used to blog as Iain Dale's Diary, later revived as Dale & Co where he recently posted Why The Libdems Will Win 30-35 Seats in 2015. In 2010 he thought they would get more than 59 – it turned out to be 57. He now reckons:
Of the 57 seats, I predict 35 will remain LibDem, 14 will fall to the Conservatives and 8 to Labour. But of the 35 LibDem Holds, I reckon only 13 are dead certs, 9 are hot bets, 8 are probable and 5 are rated as possible, but by no means definite. 
In the predictions … I have assumed that Labour will be the beneficiaries of most of the decline in LibDem votes across the country but that the Conservatives might benefit a little in the south and south west. The big unknown factor here is how the size of the UKIP vote might affect existing Conservative vote levels in many of these seats. I have tried not to make these predictions through blue tinted spectacles, but it maybe that I will have underestimated the impact of UKIP. I have also assumed that the LibDems will not win a single one of their top 20 target seats.

The last time I posted here about the Lib Dem prospects in the South West (2010 outcome above), I concluded:
If the Conservatives are to form a majority government after the 2015 election, as well as taking Labour seats in the North West and North East, they will have to take many of the 15 Lib Dem seats in the South West. My feeling is that the Tories will find that difficult …
So I was interested to see Dale’s opinions for the South West 15 extracted in the table and ordered by the size of the majority in 2010: The spectrum of his opinions from ‘DEAD CERT LIBDEM HOLD’ to ‘CONSERVATIVE GAIN’ match the size of the majority with two exceptions, as shown, Bath and St Ives. The first presumably would be ‘DEAD CERT’ if the present incumbent weren’t stepping down. Dale thinks that the Tories may not win the second because of their voters turning to UKIP.


I thought it might be interesting to use Electoral Calculus’s “make your own predictions” facility, (as featured in a recent post here about the main parties tying) which identifies which individual seats will change hands. The next table shows the Electoral Calculus (EC) predictions for the seats under three different scenarios. A is the EC Current Prediction on 6 February 2014, B is the state of the parties as assessed by the School of Politics and International Relations at the University of Nottingham blog, Ballots and Bullets, on 13 January, and C is a guess at what a Lib Dem recovery and UKIP doing well, both at the expense of the main parties, might produce.


It’s interesting to see that at the highest level of support (37.6%) Labour gains Bristol West from the Lib Dems. It would also, according to EC, be able to take Conservative seats: Plymouth Sutton and Devonport, Kingswood, Stroud and Somerset North East. The last of these is Jacob Rees-Mogg’s seat.

Unless the Lib Dems retain more supporters in the South West than they have been able to do so far nationally, it looks as though they will be losing more seats than I thought.


29 January 2014

The ‘Other’ thing about polls

Some opinion polling earlier this week showed that Labour’s lead over the Conservatives had dropped to 1 or 2%. This generated excitement among those who like the narrative that recent indications of economic improvement in the UK should be followed by an upturn in Tory support. Over-excitement in the case of the normally level-headed and fastidious Iain Martin:


At the time I was working on the previous post about the consequences of the main parties having the same share of the vote, so some statistics to be kept in mind were readily available and are described below.
In the UK we have the two main parties who have had vote shares in general elections since 1945 in the 30 to 50% range, and the Liberal Democrats (Liberals up to 1987) who have been somewhere between 2.5% and 25%. In the 2005 election UKIP, a party founded in 1993, had 2.2% of the votes and 3.1% in 2010. However, in the opinion polls for the last three years, UKIP’s support has been similar to that of the Lib Dems, as the chart below shows (from the School of Politics and International Relations at the University of Nottingham blog, Ballots and Bullets):


It could be argued that we now have two main parties and two secondary parties – but then what about the rest? The next chart shows the size of the “Other” vote in elections from 1945, defining “Other” as being not Conservative, Labour or Lib Dem, and not UKIP after 2005:


In no election since 1945 has “Other” been more than 10%. The Ballots and Bullets chart above implies that on a smoothed basis “Other” is 11.5% currently. So what about individual recent polls? Some from UK Polling Report for the last couple of weeks are shown in the table below, concentrating on the polling organisations which generated the ‘excitement’ referred to at the start of this post.


Those two polls are highlighted and, interestingly, show anomalous levels of support for “Other” which is usually 7 to 9% - the level in the last four general elections. The 20 January YouGov/Sun poll showing an 8% Labour lead also looks like an oddity.

Some advice for the commentariat, don’t get too excited about a poll if “Other” is less than 7% or more than 9%.


UPDATE 31 JANUARY 

Two more YouGov/Sun polls have appeared. The second shows a 10 point Labour lead, something which Iain Martin seems to have missed.


Scepticism is in order for both by my criterion above, certainly for the second one.


28 January 2014

In the unlikely event of a draw

Mike Smithson’s PoliticalBetting.com styles itself as “Britain’s most-read political blog – and the best online resource for betting on politics” and “2004-2014: The view from OUTSIDE the Westminster bubble”. Smithson comes 33rd on PeerIndex’s list of the most influential people on Twitter aged over 50, and, if there were a list for the over 65s, he would no doubt be second to Hilary Clinton. No sour grapes here – I read his blog and follow him on Twitter, where I was alerted to this on 21 January:


and it’s been making me think about some of the issues it raises, in particular what happens if the two main UK parties were to get the same percentage share of the vote in the 2015 general election.

I looked at the outcomes of the 18 general elections between 1945 and 2010:


It can be seen that, firstly, in only 3 of the 18 were the percentages within 1% and none between 1 and 2%:


so it isn’t a common occurrence, and,secondly, the percentages of votes given to the two main parties have been reducing over the period. This comes out in the next chart which shows that since the 1950s the “Market share” of the two main parties has been declining and has usually been below 75% for the last 40 years, and that the difference between the two main parties has been over 5% for most of the last 30 years. 


The final greyed out columns are not for an election but the recent position as concluded by the School of Politics and International Relations at the University of Nottingham blog, Ballots and Bullets (whose work I have quoted here before). I’ve taken their recent chart and extrapolated it (linearly!) to the assumption made by Smithson in his tweet relating to 7 May 2015 of Conservative and Labour drawing at 35%:


I thought it might be useful to make use of Electoral Calculus to conduct some sensitivity testing of Smithson’s result. The next chart (a bit of an eye-glazer for those who aren’t chart-minded) explores what happens in terms of seats won if the Lib Dem share of the vote is fixed at 8%, and the two main parties tie at 33 to 38%. UKIP gets squeezed from an 18% share at the 33% each level to only 8% if they get 38%. (The percentage of the vote given to Greens, Nationalists etc is kept at 8% level Smithson used.)


For reference I’ve added the Smithson point (35%/35% for the main parties, 12% UKIP, 10% Lib Dem). This, and other sensitivity testing which I haven’t plotted here, reveals that for likely situations in which the two main parties tie, ie in the 35% region and without a total collapse in the Lib Dem vote or a major upsurge in UKIP’s, the outcomes lie inside the dotted ellipse.

The final chart puts these outcomes in the broader context of securing a majority in a 650 seat House of Commons. For interest, I’ve added the results achieved in the two previous elections where the main parties had very close shares of the vote, 1964 and 1974, (these shares and the Lib Dem percentage shown) and were close to the number of seats to form a majority (1974 below, 1964 just above). Further elections followed soon afterwards.


If there is any precedent for a draw in 2015, it seems to be 1974 but such close shares of the vote are uncommon.


17 November 2013

Presenting Poll Data

Back in August, Matthew Holehouse posted on his Telegraph blog a chart produced by Electoral Calculus. The following month John Rentoul was very taken with it, calling it the “Chart of the Year” (version below) in his Eagle Eye blog for the Independent on Sunday.


The chart presents what Holehouse called “the polling trajectories of the last seven general elections”. Perhaps not exactly a trajectory because each of the lines has only three points: the beginnings of the lines mark the polling forecast two years before the election, the dot in the middle marks one year before election day, and the dot at the end is the final outcome. The colour of the line is that of the party in power since the last election, and the colour of the end dot indicates the outcome.

Now, I realise that some people’s start to glaze over with this sort of stuff, so perhaps best for them not to read on. But here are some points which occurred to me:
The 1992 outcome (Con 41.9 %, Lab 34.4 %) seems to be wrongly plotted.
I’ve added the current (mid-November) UK Polling Report Average (Con 31 %, Lab 39 %).
I’ve turned the 2010 result into a purple dot to represent the Coalition.
The points labelled ‘a’ and ‘b’, I will come to later.
I don’t understand the “LIB DEM” area in the bottom left corner.

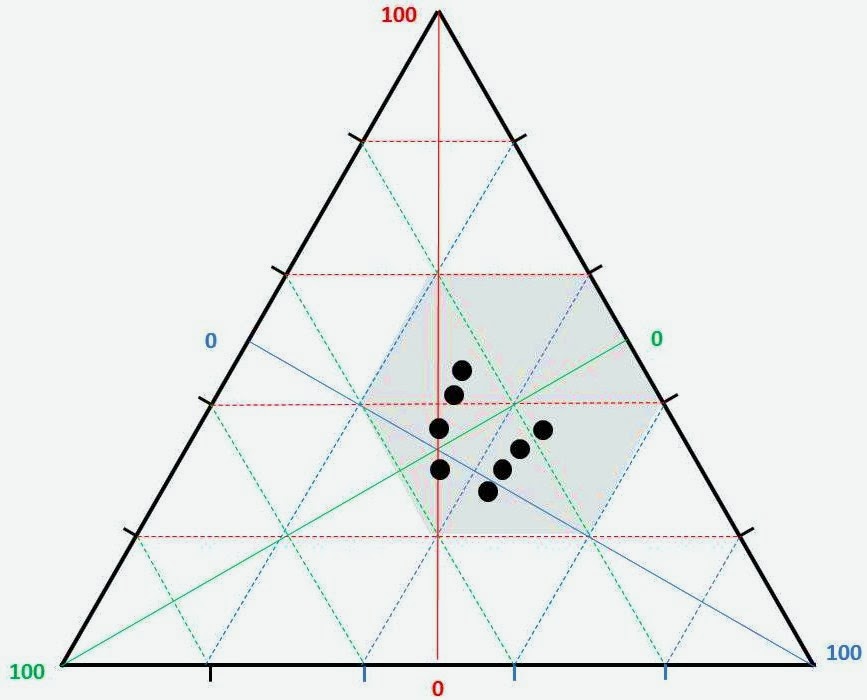
The last of these made me wonder whether a ternary plot (Wikipedia) might be of help in presenting polling results. This makes use of an equilateral triangle to locate data when three items have to add up in total to the same number (the scales run up the three vertices of the triangle). So Conservative %, Labour % and Other % have to add up to 100 % and the last eight election results can be plotted as in this chart:


All the results lie in the hexagon shown in grey and this can be used to plot the results and add in more detail: It shows the election results since 1970 in sequence, the majority boundaries which were provided by Electoral Calculus in their chart and the UKPR average as above. I’ve also added the 1945 election result for historical interest.


Does this form of presentation add any value? Possibly, (for those who can understand it and are not put off by the cluttered appearance) in terms of illuminating the consequences for the two main parties of votes being cast elsewhere.

For example, current Conservative support is back at the levels of the 1997 to 2005 elections. If Labour’s current support recedes to the level it was at in 2005, then, for the Tories to achieve a majority, the Other vote would have to drop to less than 25%. It hasn’t been so low in an election since 1979.

However, the Lib Dem level of support is currently at 10%, lower than at any election since 1970 and they are at present only one-third of the ‘Other’ vote. If they remain as unpopular but returned to being two-thirds of the ‘Other’ vote (as in elections from 1979 to 2005), the latter would drop to about 15%. The rest of current ‘Other’, (ie about 20%) could return to the two main parties rather than not vote at all. In the unlikely event of all these voters turning to the Tories in 2015, they would probably get a majority (‘a’, horizontally to the right from the November 2013 point). If as many as 5% transfer to Labour, even if 15% vote Tory, Labour has a majority (‘b’).

The poll data is in the Table below. To be honest, while the ternary plot is mathematically correct, I don’t think it adds much to Electoral Calculus’s more conventional form of plotting, which is probably quite enough for a lot of people.


9 September 2013

A different perspective on the polls

Ballots & Bullets is the blog produced by members of the School of Politics and International Relations at the University of Nottingham. They recently posted their 28th analysis of UK political opinion polling, Too Early to Tell Outside the Westminster Bubble. In essence, the point they are making is that whatever the “Westminster Village”, as they call the commentariat, may have been saying about the fortunes of the parties, there was no significant change in the poll data in August:
The shortcomings of “Westminster Village” groupthink have been amply on display this summer , The prevailing narrative of the summer was that Labour was divided and weakly led, and that this was harming them with the voters, a judgement which had little basis in the polling evidence. The Syrian crisis has produced a new rush to judgement in the Village, with journalists of differing political persuasions declaring it a death blow for David Cameron, Ed Miliband or both. But in reality it has not changed the political weather outside Westminster much, nor is it likely to. Most voters were against the Syrian intervention, and therefore happy that it is not proceeding. The average voter packing up her barbeque and preparing her kids for the new school year knows little, and cares less, about the obtuse arguments about motions, amendments and Parliamentary authority which have so excited the Villagers. Their judgement about the two leaders’ apparently disastrous performances has been an indifferent shrug of the shoulders. In the latest figures from the Polling Observatory, we have seen virtually no change since the start of August. …
And this is the chart, “pooling together all the available polling evidence” they published to illustrate their point:

I happened to be reading this post on my iPad, so selecting the chart enlarged it nicely to full-screen. Keeping the iPad horizontal and rotating it by 90 degrees anticlockwise, gave a perspective more like this, but better:

It looked to me as though there were two axes of near-symmetry: the brown one between the Lib Dem and Labour levels of support and the grey one between the Conservative and UKIP levels.  If so, it could be interpreted as Labour’s rise in the polls since 2010 being gained largely at the Lib Dem’s expense and similarly UKIP picking up mostly Tory votes. Of course, some people who voted Lib Dem or Labour may have moved to UKIP, and some Conservative voters to the Lib Dems, but I would be amazed if there were that many.

Perhaps it’s not so surprising that Ed Miliband wanted nothing to do with Syria, given the dislike among Lib Dems (erstwhile Labour voters possibly) of the UK’s previous involvement in Iraq. And the Tories have made no secret of their intention, with the encouragement of Lynton Crosby (reportedly no admirer of the commentariat) to go after UKIP.

I continue to think that a sustained economic recovery in the next couple of years is the biggest risk to Labour’s chances in 2015. But it will have to come in a form which encourages disillusioned 2010 Lib Dem voters to return to their fold – difficult, or UKIP enthusiasts to go back to the Tories – less so. Neither may be sufficient to produce the lead which the Tories require to form a majority.

It was Osborne’s inheritance tax proposal which wrecked Labour’s plan to call an election in 2007, as discussed here before (towards the end of this rather long post). I wouldn’t be surprised to see this particular carrot reappear before 2015 in view of its attractiveness to the UKIP age group. The headline to Kellner’s comment that UKIP voters are poorer than Tories derives from a smaller proportion having household income less than £40k per year. But for the age group (71% over 50, as opposed to 46% of all electors) many will be pensioners who have lower incomes but will have acquired capital, primarily in the form of housing.


23 May 2013

Opinion polls – a Thatcher effect?

While I don’t spend much time here on political opinion polling, I do follow the excellent UK Polling Report which, among other things, draws together all the intention to vote data. While no one poll can be taken too seriously, and also recognising the fact that different pollsters make different adjustments to their raw data, in aggregate it might be possible to make out some signal in the noise. (I will return to Nate Silver’s book in due course).

Looking at the chart on the right, the percentage levels of support for the two main parties and for the two lesser ones didn’t seem to change much up to the end of March from early February and actually from well back into 2012. Then on 8 April Margaret Thatcher died, and in the period up to her funeral on 17 April (black bar), her life and political philosophy received extensive media coverage, not all uncritical. Not surprisingly this period seems to indicate a slight increase in the Conservatives’ support and a decline in Labour’s.

Since the funeral, there seems to have been a decline in support for both of the main parties. This has been to the benefit of UKIP, but has left the Lib Dems’ position unchanged. UKIP did well in the local elections on 2 May 2013 (green dot) and has reached new highs in support since. Perhaps the intense Thatcher coverage in April stimulated nostalgia in some older voters, particularly Tory ones, for the “old time religion” of her period in office. UKIP’s Nigel Farage offers something closer to it than either David Cameron or Ed Miliband.  If so, will enthusiasm for UKIP wear off in time, or will it last?


24 October 2012

Update on the Royal Navy’s Trident

In 2006 the Labour government announced that the UK would construct new nuclear submarines to carry the Trident missile system. Since then two issues have emerged which have been the subject of posts here: a review of alternatives to Trident, which was a Lib Dem element within the 2010 coalition agreement, and the implications of Scotland becoming independent, the Royal Navy's Trident submarines currently being based there.

Posts here on the first of these appeared in June (concentrating on the ‘Moscow criterion’) and in September just after the cabinet reshuffle. Nick Harvey, who had led the review, ceased to be a minister and his role was transferred to another Lib Dem, Danny Alexander. Harvey later addressed a fringe meeting at the Lib Dem annual conference, his remarks appearing at length in the Guardian on 27 September:
… to convince ourselves that the only point of having any deterrent at all is the capability of flattening Moscow is the wrong and distorting lens through which to view the debate."  
Instead of replacing Trident with a like-for-like 24-hour nuclear armed submarine presence at sea after the current system is due to be taken out of service in 2028, cheaper alternatives are being considered. These range from stepping down the patrols, to designing missiles to be launched from aircraft, surface navy ships or land, to a delayed launch system.  
The delayed-launch model would involve developing a nuclear warhead for a cruise missile that could be launched from existing Astute submarines, Harvey said, "but having perfected that technology simply put it away in a cupboard and keep it as a contingency in case there ever were to be a deterioration in the global security picture that might need the UK government to take it out of the cupboard".  
In this situation, the UK would store the warheads in a secure military location, from where they could be removed, put on the tip of a missile and put to sea within weeks or months.  
… Harvey told a fringe debate at the Liberal Democrat conference in Brighton that the idea of moving "down the nuclear ladder" had support across all three armed services: the army, the Royal Navy and the RAF. He said one reason for growing support for the review's alternatives was a "perfect storm" of defence capital costs around 2020, including building the new joint strike fighter aircraft and Type 26 frigates, a new generation of unmanned aircraft, and amphibious craft for the navy.
At the PMQs on 17 October, the first after the party conferences, Harvey was able to return to this theme, but only after an earlier question by a Conservative MP who is well-known as a supporter of the UK nuclear deterrent:
Mr Speaker: Question 4 is a closed question.  
Nuclear Deterrent  
Q4. [122163] Dr Julian Lewis (New Forest East) (Con): Whether he remains committed to the continuation of the UK’s Trident nuclear deterrent after the Vanguard submarines are withdrawn from service.  
The Prime Minister: My hon. Friend will be delighted to know that the answer is yes, we are committed to retaining an independent nuclear deterrent based on the Trident missile system. That is why we have continued with the programme to replace the Vanguard class submarines, including placing initial design contracts with BAE Systems.  
Dr Lewis: That is indeed an excellent answer. Given that a part-time nuclear deterrent would be dangerously destabilising, will the Prime Minister confirm that the British Trident successor submarines must and will operate on the basis of continuous at-sea deterrence [CASD]?  
The Prime Minister: My hon. Friend is absolutely right to raise this issue. One of the key elements of the credibility of our deterrent has been that it is continuously at sea, and the Royal Navy takes immense pride in having been able to deliver that without a break over so many years. I have met some of the crews and visited some of the submarines. What they do is incredibly impressive and I pay tribute to them for the service that they provide. Yes, being continuously at sea is a key part of our deterrent.
later:
Sir Nick Harvey (North Devon) (LD): Returning to the Trident issue, has the Prime Minister looked at the severe cost pressures facing defence at the very moment the Trident replacement has to be paid for? Joint strike fighter airplanes, Type 26 frigates, unmanned aircraft and Army vehicles all need paying for at much the same time. This has to come out of the defence budget, and austerity will be with us for some time yet, so will he keep an open mind about how exactly to replace our nuclear deterrent?  
The Prime Minister: All the things that my hon. Friend lists are programmes that are fully funded and will be properly invested in, because, as he well knows—because he played a major role in it—the Government have sorted out the defence budget. Having carefully considered the issue of the nuclear deterrent, I do not believe that we would save money by adopting an alternative nuclear deterrent posture. Also, if we are to have a nuclear deterrent, it makes sense to ensure we have something that is credible and believable, otherwise there is no point in having one at all.
A post here in February considered the practicalities of removing Trident from Scotland after independence and another in March attempted to put some bounds on the cost. In June Harvey and another defence minister, Peter Luff, gave oral evidence to the Scottish Affairs Committee on the subject. Currently only an uncorrected transcript is available with the caveat that “Any public use of, or reference to, the contents should make clear that neither witnesses nor Members have had the opportunity to correct the record. The transcript is not yet an approved formal record of these proceedings.” Subject to that, the evidence at Questions 315 to 351 is worth reading in full, but particularly noteworthy are:
Q326 Mr Reid: Have you done any planning as to how long it would take to replicate the facilities at Faslane and Coulport elsewhere in the UK?  
Nick Harvey: While it would be possible to do so, it would be fraught with difficulty. It would be a very challenging project, which would take a very long time to complete and would cost a gargantuan sum of money. When the facilities there were upgraded for Astute and the previous upgrade of the nuclear deterrent, the cost of that upgrade in today’s prices was about £3.5 billion. That was upgrading an extant facility. If we were to replicate it somewhere else, that figure would be dwarfed by whatever that would cost. … The costs would be absolutely immense. I would have thought that relocation would be just about the least favoured option that it would be possible to conjecture.  
Q343 David Mowat: I was just reflecting on this approximately £5 billion figure for moving Trident. Effectively that is one of the costs of separation. …  
Nick Harvey: The only figure that I have used was that a previous upgrade in today’s money cost £3.5 billion and I felt that that would be dwarfed by the cost of re-establishing-  
Q349 Chair: … if the Scottish Government did win, we had separation, they wanted Trident out and they were willing to be reasonable, they would have to be satisfied that you had no alternative but to keep them there for 20 years. It is not an unreasonable point to pursue with you.  
Nick Harvey: I am not saying that anything cannot be done.  
Q350 Chair: Good. That is the first time the MOD has ever said that.  
Nick Harvey: I am saying it would be difficult and not straightforward.  
Q351 Chair: Ah yes-that is the traditional MOD caveat. You forgot to mention expensive.  
Peter Luff: And lengthy.  
Nick Harvey: I took all of that as read.
The SNP at its party conference this month decided that their policy should be that an independent Scotland should become a member of NATO but that the SNP leadership should first seek an agreement that Scotland could be nuclear-weapon free. Their leader, the Scottish First Minister Alex Salmond, said in an interview on BBC1's The Andrew Marr show on 21 October:
Nobody seriously believes that Scotland as a country of 5.25 million people would want to be in possession of nuclear weapons. That would be a bad thing for Scotland; I think it would be a bad thing for nuclear proliferation across the world. So our opposition to stationing or hosting nuclear weapons in Scotland is unconditional. What we do say, however, because we have substantial indications that our friends and allies want cooperation, we'd be happy to be a member of NATO on a non-nuclear basis. 
When he was asked by Marr how the UK could deal with this, Salmond said it would be "far better" if it was "curtains for Trident", but that Trident removal would have to be "as soon as can be safely arranged." He ruled out a Cyprus sovereign base arrangement. The RN could "either relocate Trident to another facility in the rest of the UK or alternatively they could use the nuclear facilities in America, or in France for that matter. Trident is effectively an American weapon.” 

The last comment was disingenuous: the Trident missile system is American but the submarines and warheads are made in the UK – or in England as Salmond would see it. The diplomatic and logistical problems of relocating RN Trident to another country are obvious but, of course, would not be Salmond’s problem, nor would establishing another facility in England or Wales. He will have his hands full enough however in attempting to negotiate with NATO on the terms proposed while at the same time many in his party are unhappy with joining the Alliance at all. Two MSPs announced their resignation over the issue on 23 October.

So where does this leave the RN and the UK deterrent? The PM seems to have pre-empted the Lib Dem review of alternatives by endorsing Trident and CASD. But, if in 2014 Scottish independence proceeds on the basis of current SNP policies, would the remaining UK embark on the “difficult and not straightforward, … expensive and lengthy” undertaking of rebasing Trident? Ian Jack in an article in the Guardian in September, The SNP says it would kick Trident out of Scotland. But at what cost?, drew attention to the prosperity of the part of Scotland adjacent to the Trident base – indicated by the presence of one of that nation’s five branches of Waitrose:
So in the process of Scottish independence, as yet hypothetical, my guess is that Trident will become a bargaining chip to be deployed by Edinburgh's negotiating team in exchange for a big London favour. (Bigger oil rights? A smaller share of the national debt?) Its bases will survive where they are on leasehold into the mid-2020s, when the submarines are due to be replaced, at a currently estimated cost of £25bn. But, sadly for the shipworkers of Barrow, there will be no replacements. A truncated UK will then have lost the taste and the budget for "punching above its weight", and Trident submarines will be seen as what they are: a strange consequence of British military ambition in the last century, as beautiful and terrible in their way as the Dreadnought, though unlike the Dreadnought (one hopes) never used. And so they will quietly pass away, leaving Helensburgh's Waitrose among their monuments.
Recent opinion polls indicate 30 to 40% of the Scottish electorate in favour of independence, 50 to 60% against.

Meanwhile the US Navy has problems of its own, made clear at the recent annual conference of the Naval Submarine League. The USN will need new submarines for its ballistic missiles to be in service from about 2030 to 2080. At some point in those years a new missile to replace Trident will be required, and there is scope for cooperation with the US Air Force, but:
The other crucial partner on ballistic missiles is the United Kingdom, whose only remaining nuclear weapons are on its Vanguard submarines. Ironically, the [US] Navy has a better record of collaboration with the Brits than with America's Air Force. The Royal Navy has relied on U.S.-designed missiles since the Polaris Sales Agreement was signed in 1963. Even after the Americans delayed the SSBN(X) program by two years, they stuck to the original schedule to develop the missile compartment so it would be ready in time for the British could use the design in their own new missile submarine, which must enter service two years before the American sub.
 
ADDENDUM 25 OCTOBER

The Scottish Affairs Committee has now published a report, The Referendum on Separation for Scotland: Terminating Trident—Days or Decades?. The Chair of the Committee, Ian Davidson, MP said:
A separate Scotland would be presented with a choice over Trident: it could honour the longstanding commitment of the SNP that there should be no nuclear weapons in Scotland and insist on the ‘speediest safe transition’ of Trident from Scotland. In reality, Trident can be deactivated within a matter of days, and the warheads removed within twenty four months. In the process, the UK would lose the ability to operate its nuclear deterrent and effectively be forced into unilateral disarmament, for an indeterminate period.  
Alternatively, a separate Scotland could allow Trident to remain on the Clyde long enough for the UK to identify and develop a new base elsewhere. This option would mean armed nuclear submarines operating out of Scotland for twenty years or longer. Developing a new base, particularly replicating the facilities at Coulport, could only be done at great expense, and the UK Government has made it clear that any such costs would be included in the Separation negotiations.