
The chart presents what Holehouse called “the polling trajectories of the last seven general elections”. Perhaps not exactly a trajectory because each of the lines has only three points: the beginnings of the lines mark the polling forecast two years before the election, the dot in the middle marks one year before election day, and the dot at the end is the final outcome. The colour of the line is that of the party in power since the last election, and the colour of the end dot indicates the outcome.
Now, I realise that some people’s start to glaze over with this sort of stuff, so perhaps best for them not to read on. But here are some points which occurred to me:
The 1992 outcome (Con 41.9 %, Lab 34.4 %) seems to be wrongly plotted.
I’ve added the current (mid-November) UK Polling Report Average (Con 31 %, Lab 39 %).
I’ve turned the 2010 result into a purple dot to represent the Coalition.
The points labelled ‘a’ and ‘b’, I will come to later.
I don’t understand the “LIB DEM” area in the bottom left corner.
The last of these made me wonder whether a ternary plot (Wikipedia) might be of help in presenting polling results. This makes use of an equilateral triangle to locate data when three items have to add up in total to the same number (the scales run up the three vertices of the triangle). So Conservative %, Labour % and Other % have to add up to 100 % and the last eight election results can be plotted as in this chart:
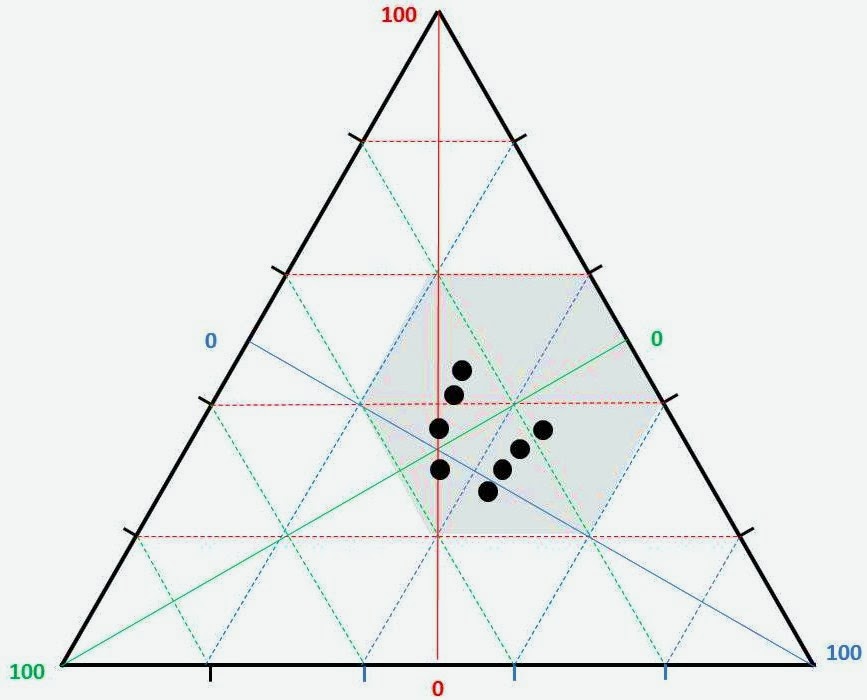
All the results lie in the hexagon shown in grey and this can be used to plot the results and add in more detail: It shows the election results since 1970 in sequence, the majority boundaries which were provided by Electoral Calculus in their chart and the UKPR average as above. I’ve also added the 1945 election result for historical interest.

Does this form of presentation add any value? Possibly, (for those who can understand it and are not put off by the cluttered appearance) in terms of illuminating the consequences for the two main parties of votes being cast elsewhere.
For example, current Conservative support is back at the levels of the 1997 to 2005 elections. If Labour’s current support recedes to the level it was at in 2005, then, for the Tories to achieve a majority, the Other vote would have to drop to less than 25%. It hasn’t been so low in an election since 1979.
However, the Lib Dem level of support is currently at 10%, lower than at any election since 1970 and they are at present only one-third of the ‘Other’ vote. If they remain as unpopular but returned to being two-thirds of the ‘Other’ vote (as in elections from 1979 to 2005), the latter would drop to about 15%. The rest of current ‘Other’, (ie about 20%) could return to the two main parties rather than not vote at all. In the unlikely event of all these voters turning to the Tories in 2015, they would probably get a majority (‘a’, horizontally to the right from the November 2013 point). If as many as 5% transfer to Labour, even if 15% vote Tory, Labour has a majority (‘b’).
The poll data is in the Table below. To be honest, while the ternary plot is mathematically correct, I don’t think it adds much to Electoral Calculus’s more conventional form of plotting, which is probably quite enough for a lot of people.

No comments:
Post a Comment