Nigel Farage will launch an audacious attempt to steal Labour's clothes by unveiling his manifesto in Ed Miliband's seat of Doncaster and promising answers on the cost-of-living crisis and the NHS. … In a particular warning to Miliband, the MEP said he had chosen Doncaster as the perfect place to launch Ukip's general election manifesto in September
… "We have already been doing substantial work on the NHS, on defence, on education, on public spending and other areas, and we will unveil our outline manifesto for the next general election, and we will do it in a town called Doncaster," Farage said. "It is a town in which Ed Miliband is the MP, it's a town in which yesterday we topped the polls, and we will have an honest conversation with the British public about the cost-of-living crisis and about how we can make life better and more affordable for ordinary families in this country. Policy will happen in Doncaster in September."Both the Guardian and Farage were misleading in so far as the town of Doncaster lies within the Metropolitan Borough of Doncaster which has three parliamentary constituencies. Some of its wards form the parliamentary constituency of Doncaster Central. Ed Miliband’s seat is Doncaster North which, as its name suggests, includes some of the town’s northern wards and other wards in the countryside beyond. The Don Valley constituency is similarly arranged to the south of the town. The Doncaster Metropolitan Borough is part of the South Yorkshire Metropolitan County which in turn is part of the Yorkshire and Humberside Region of England.
I thought it might be of interest to pull some relevant electoral statistics together following the 2014 elections for the European Parliament. The results for the Yorkshire and Humberside region are the responsibility of Leeds City Council who have recently provided the following for the Doncaster Metropolitan Borough:

In chart form:

which can be compared with the 2009 Euro election result when there was a slightly larger turnout:
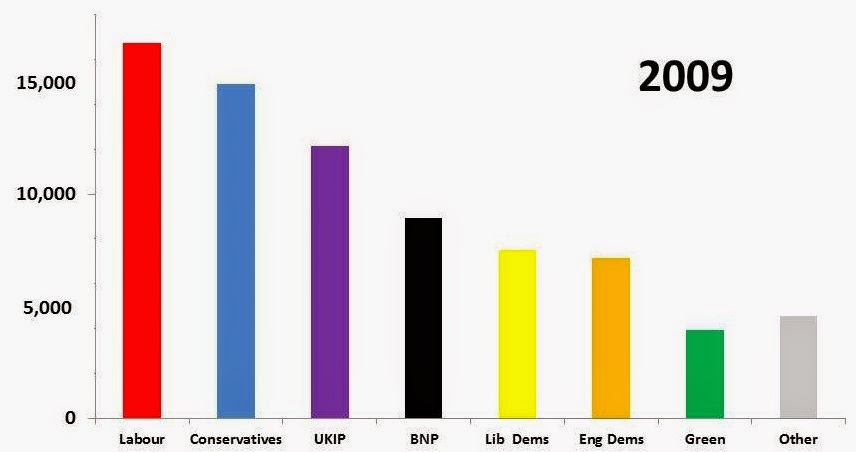
Clearly the votes in 2009 were more widely spread and the two largest parties had only 42% of the vote in contrast with 69% in 2014. At first sight it would seem likely that in 2014 UKIP benefited from the collapse of the BNP and also acquired a large part of the Tory vote. Indeed, in 2009 the combined UKIP and BNP vote had been greater than Labour’s. Labour’s vote in 2014 was increased relative to 2009, matching the decline of all the other contestants apart from UKIP, but particularly that of the Liberal Democrats.
The 2010 Westminster election (combining results across the three parliamentary constituencies; data from the three Doncaster constituency links above) had shown how the smaller parties find it difficult to sustain the number of their voters, let alone their shares of the vote, when the turnout goes up:

The pie charts give a better view of the way the vote share alters. The areas have been adjusted to match the numbers of votes cast in the three elections:

As for the 2015 parliamentary elections? Who knows – some Lib Dems may return to the fold at Labour’s expense and some Ukippers may go back to the Tories. But for UKIP to defeat Miliband, a large proportion of the 2014 non-voters who are expected both to turn out and to vote Labour in the 2015 Westminster election would have to transfer to UKIP.
No comments:
Post a Comment